Strategic alignment
Storyboarding
0-1 UX/Product design
User interface
Stakeholder management
7 minute read
Role:
Lead Product Designer shaping the demo vision and delivery
Team:
18 including Engineering, Data Science, QA, Product and 9 partners
Timeline:
12-week delivery incl discovery, testing, rehearsals and live demos
context
I led design for a live demo at I/ITSEC 2022, translating a simulation expert's vision into an executable plan for a 15-person internal team and 9 external partners. We had 12 weeks to prove our approach for the UK MOD's £1.2B programme.
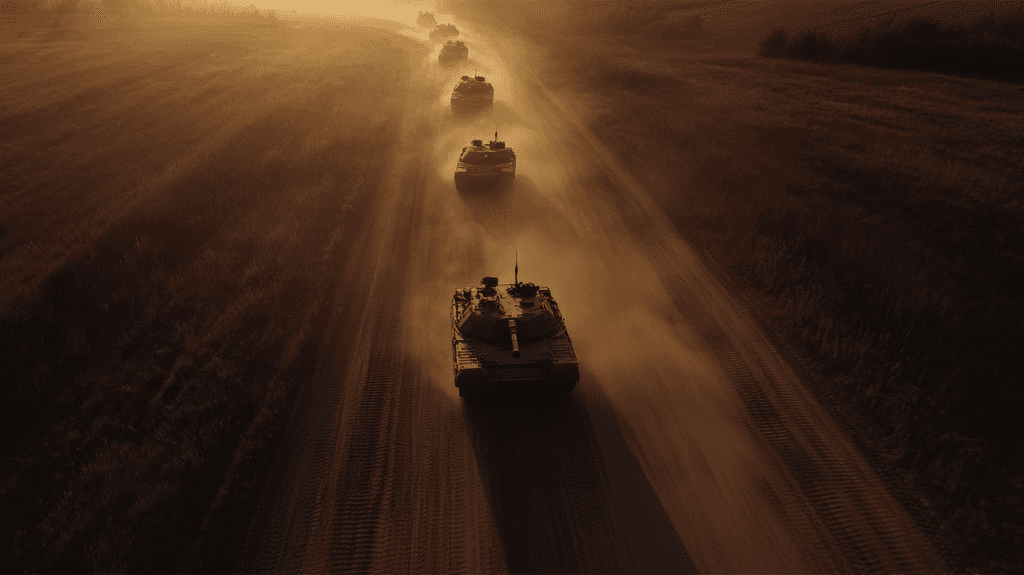
Why this matters
Large-scale collective training traditionally requires deploying thousands of troops and vehicles to training grounds. Synthetic environments complement live training, at any scale, enabling forces to train more frequently at lower cost, explore scenarios too dangerous or complex for physical exercises, and refine tactics before expensive live deployments. That's why the MOD is investing in this capability.
The opportunity
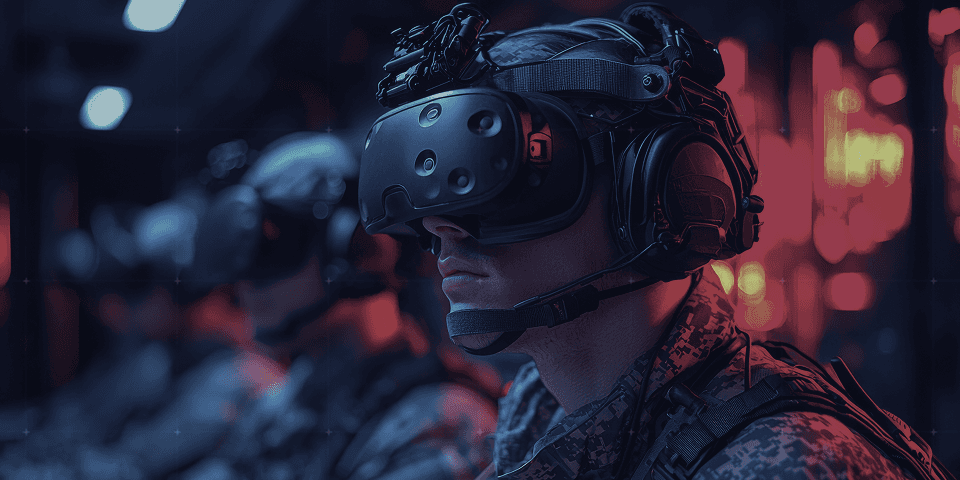
I/ITSEC is the world's largest event for modelling, simulation, and training (MS&T), attracting over 18,000 attendees from 55+ countries annually. The UK MOD was offering a £1.2B contract over 15 years to transform military training for 60,000 soldiers using AI, VR, and cloud-based simulations.
The competition
Seven major defence consortia were competing for the UK MOD's Collective Training Transformation Programme (CTTP). Improbable Defence was part of Omnia Training (Raytheon UK-led) as the "strategic synthetic integrator."
Impact beyond the demo
Originally framed as the UK MOD’s CTTP, the programme has since evolved into the Army Collective Training Service (ACTS). It is now a multi billion pound programme, and the 15-year competition remains live, with Skyral still in contention as part of the Omnia Training. The work showcased at I/ITSEC 2022 played a key role in demonstrating a credible, scalable synthetic training approach and helped keep the consortium competitive in an ongoing UK MOD procurement.
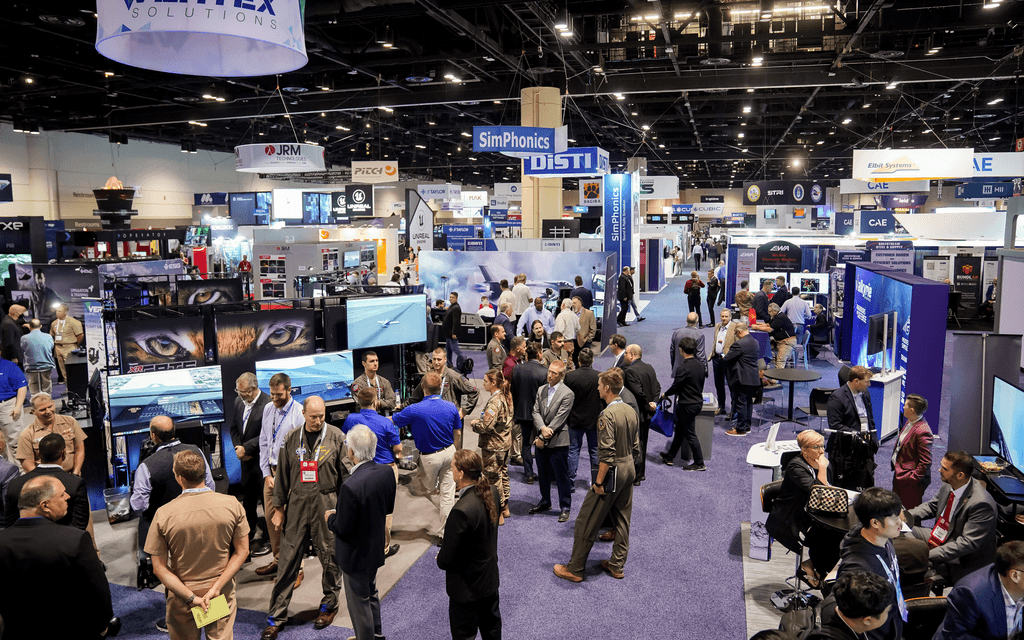
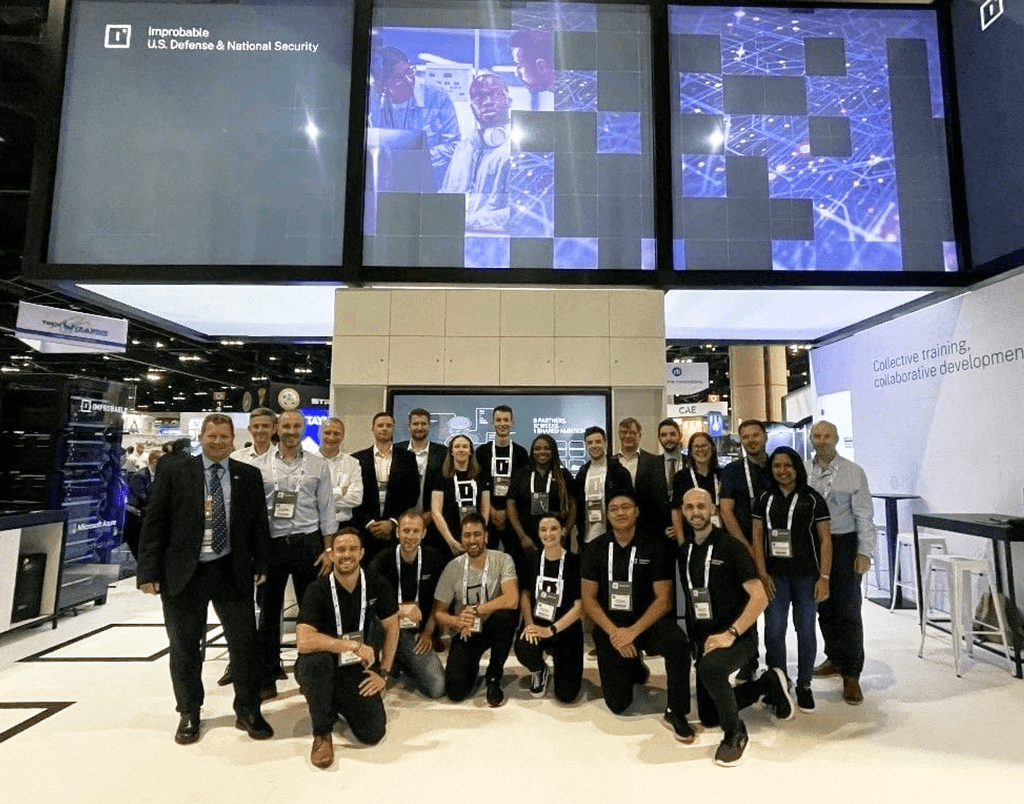
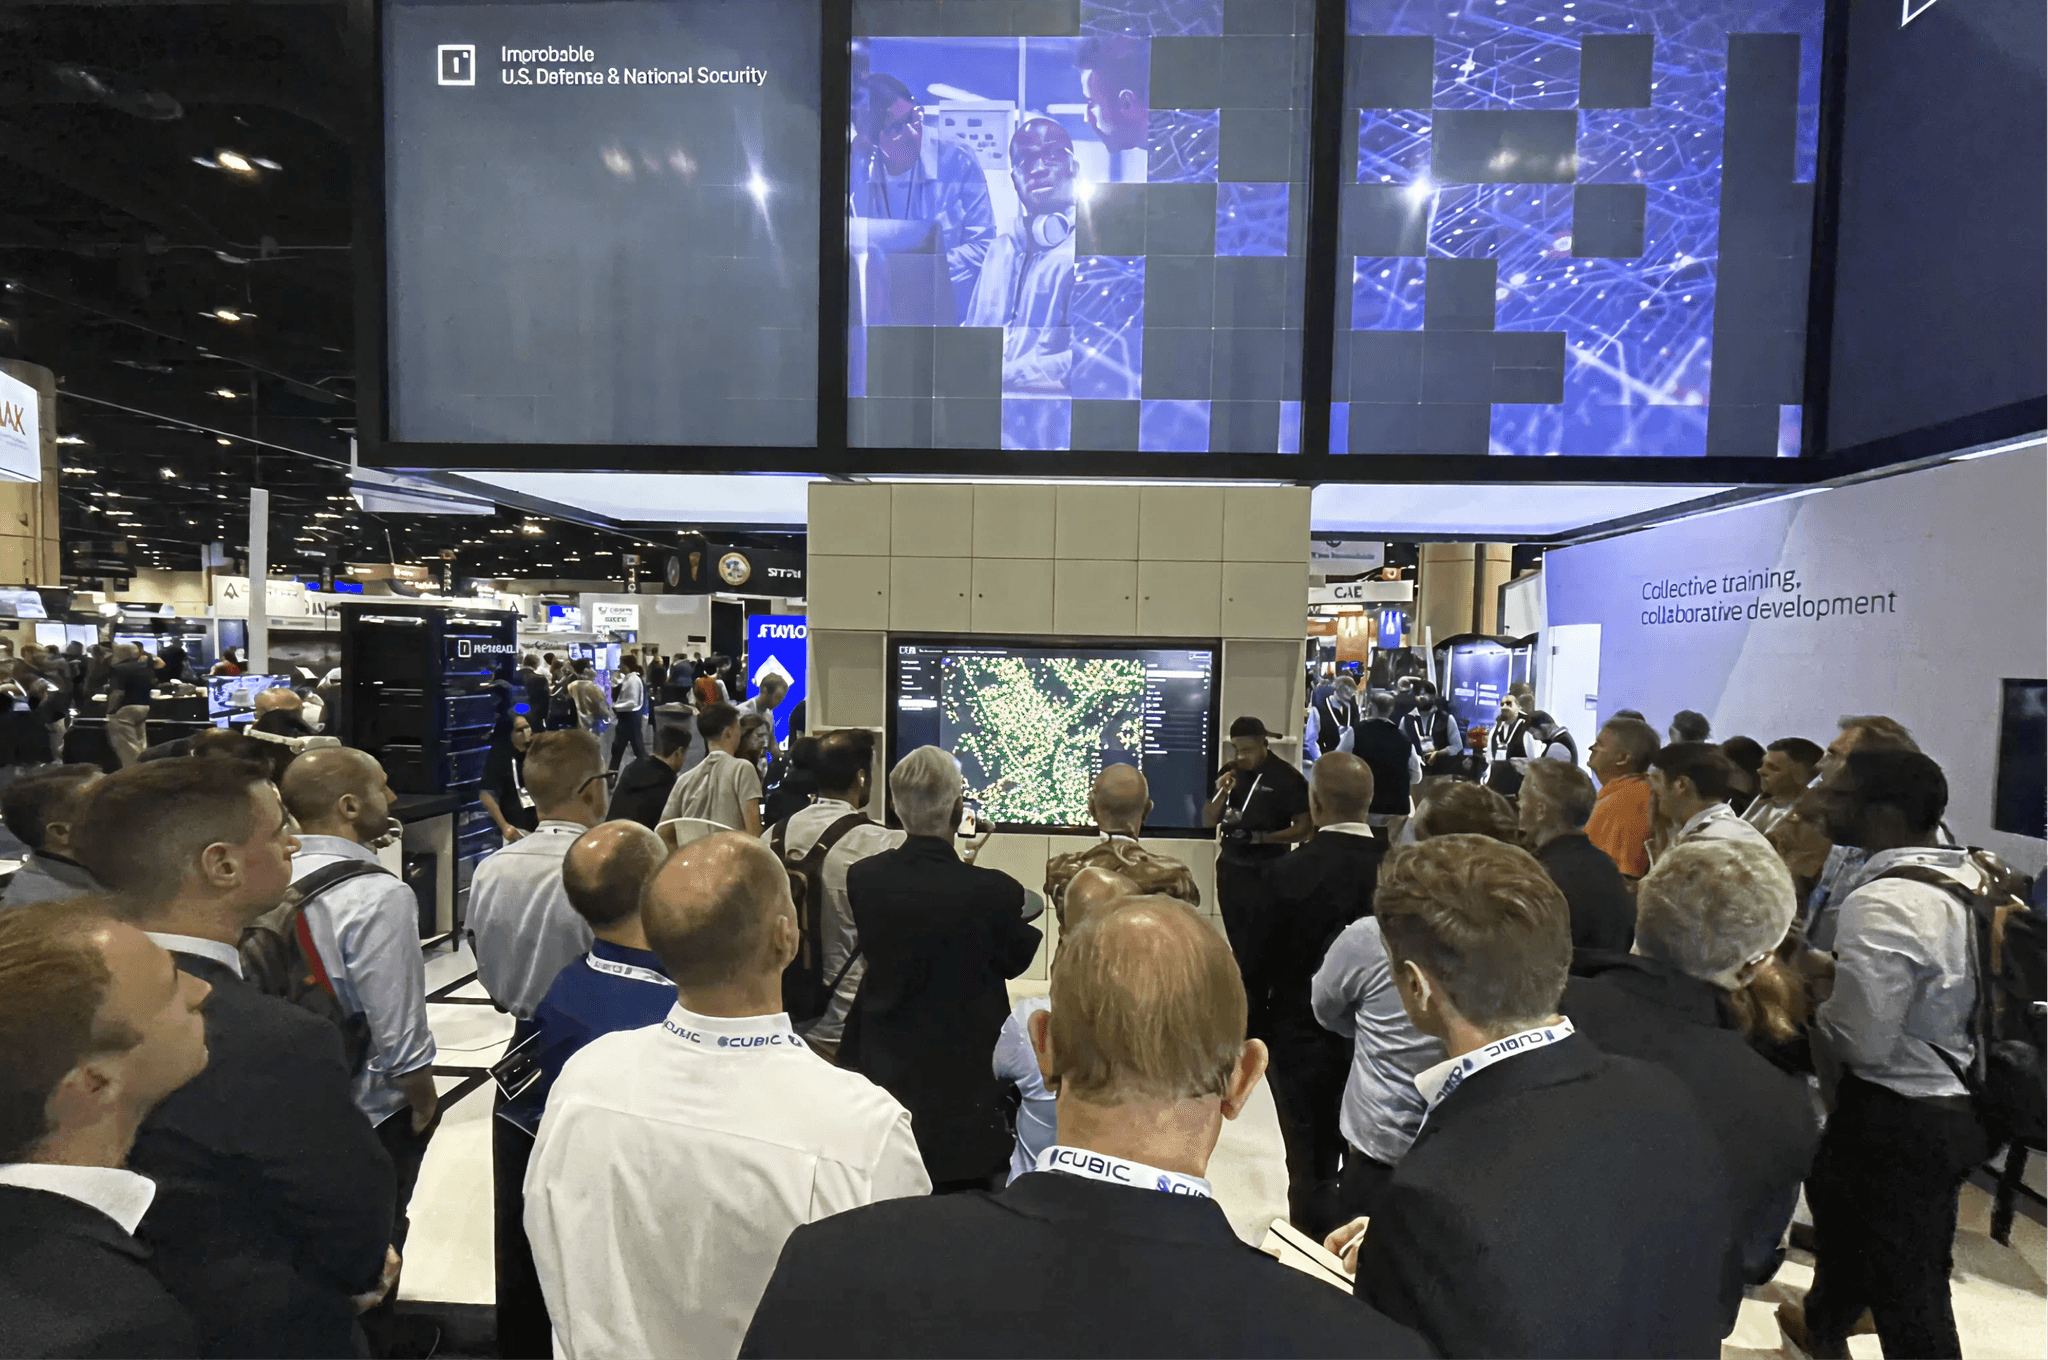
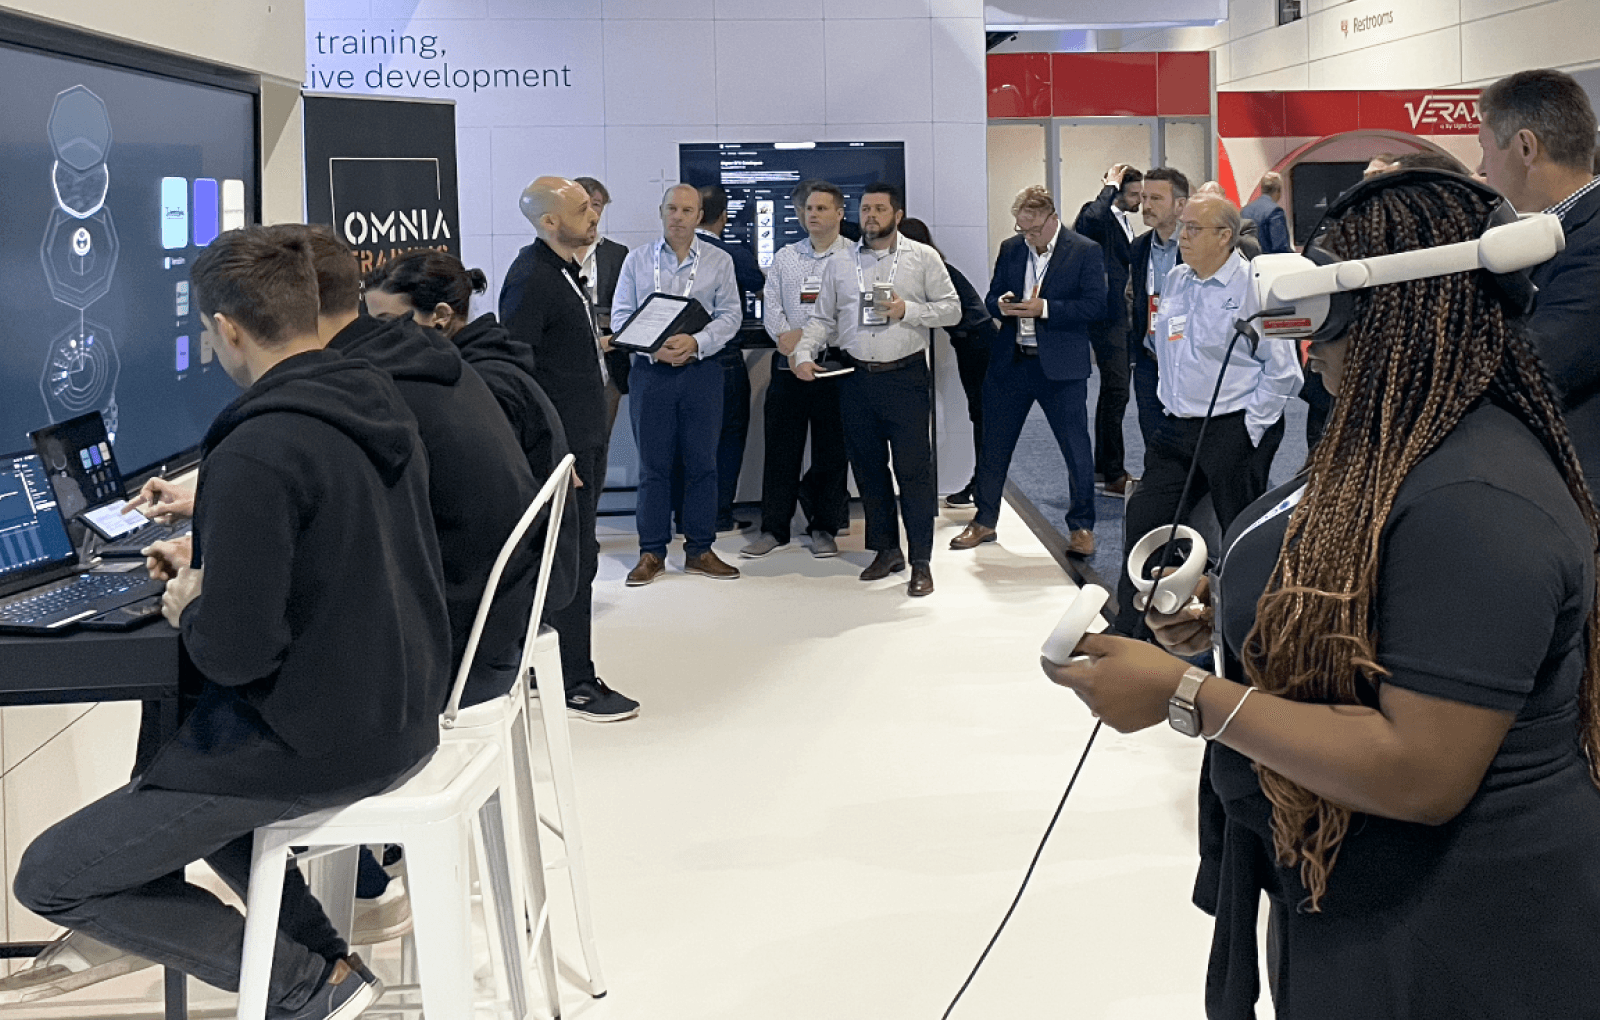
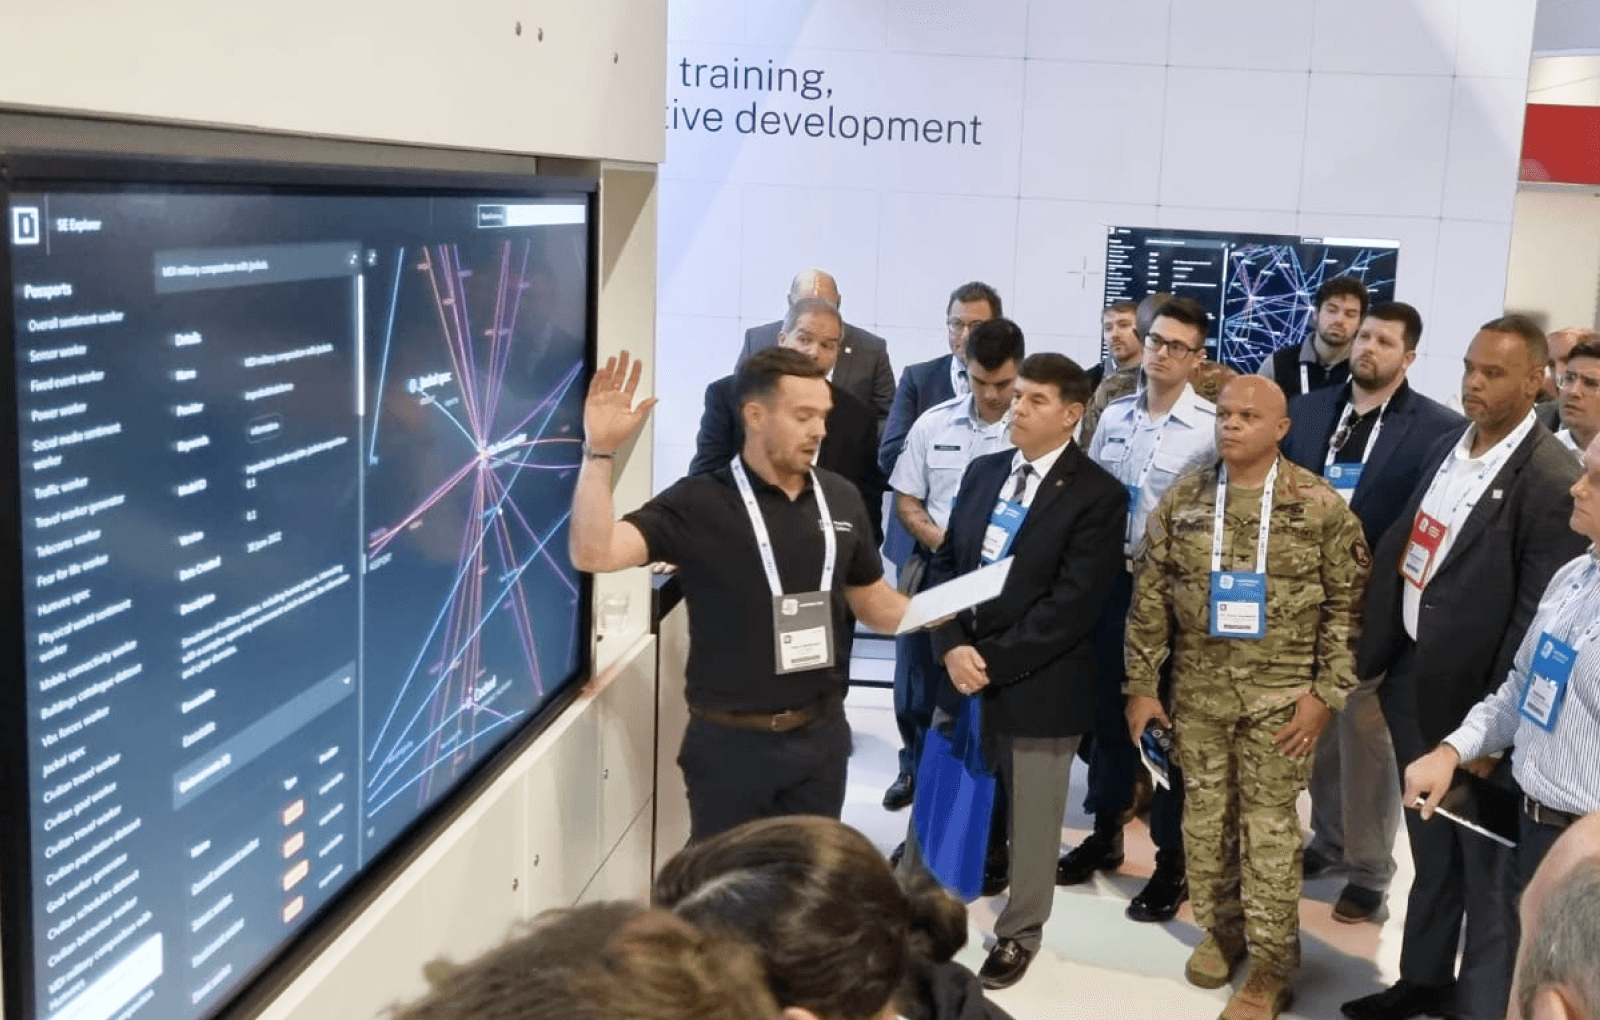
Exhibition hall at I/ITSEC, Orange County Convention Center, Florida
The challenge
Lead the design for a live demo proving our consortium could deliver seamless multi-partner integration across virtual, constructive, and live (LVC) training systems.
Our simulation expert's ambitious vision was trapped in a complex spreadsheet that everyone interpreted differently. Engineers, partners, military SMEs, and the product team all saw different things when they looked at the plan. I needed to do the following:
Create shared understanding across fifteen people from different disciplines and nine organisation
Ensure military SMEs validated the scenario's realism
Deliver a flawless live demonstration that would differentiate us from six competitors
Design an interface that unified sentiment feeds, geospatial overlays, and analysis tools into a coherent experience
Approach
I spent the first two weeks working intensively with our simulation expert, translating his complex spreadsheet into a visual storyboard that showed the demo from the audience's perspective, frame by frame, moment by moment.
The storyboard became both a blueprint for engineers and a contingency plan in case the live demo wasn't ready for the conference.
What the storyboard showed:
Frame-by-frame screen content (four screens at times) by timestamp
What the narrator would say at each moment
Which technical capabilities we were demonstrating
Which partner technologies were showcased
Where the "wow moments" would hit
The results, the 'glue':
Engineers could see what to build
Partners could see how they'd be featured
Military SMEs could validate realism
Product team could see value propositions
Everyone finally saw the same thing
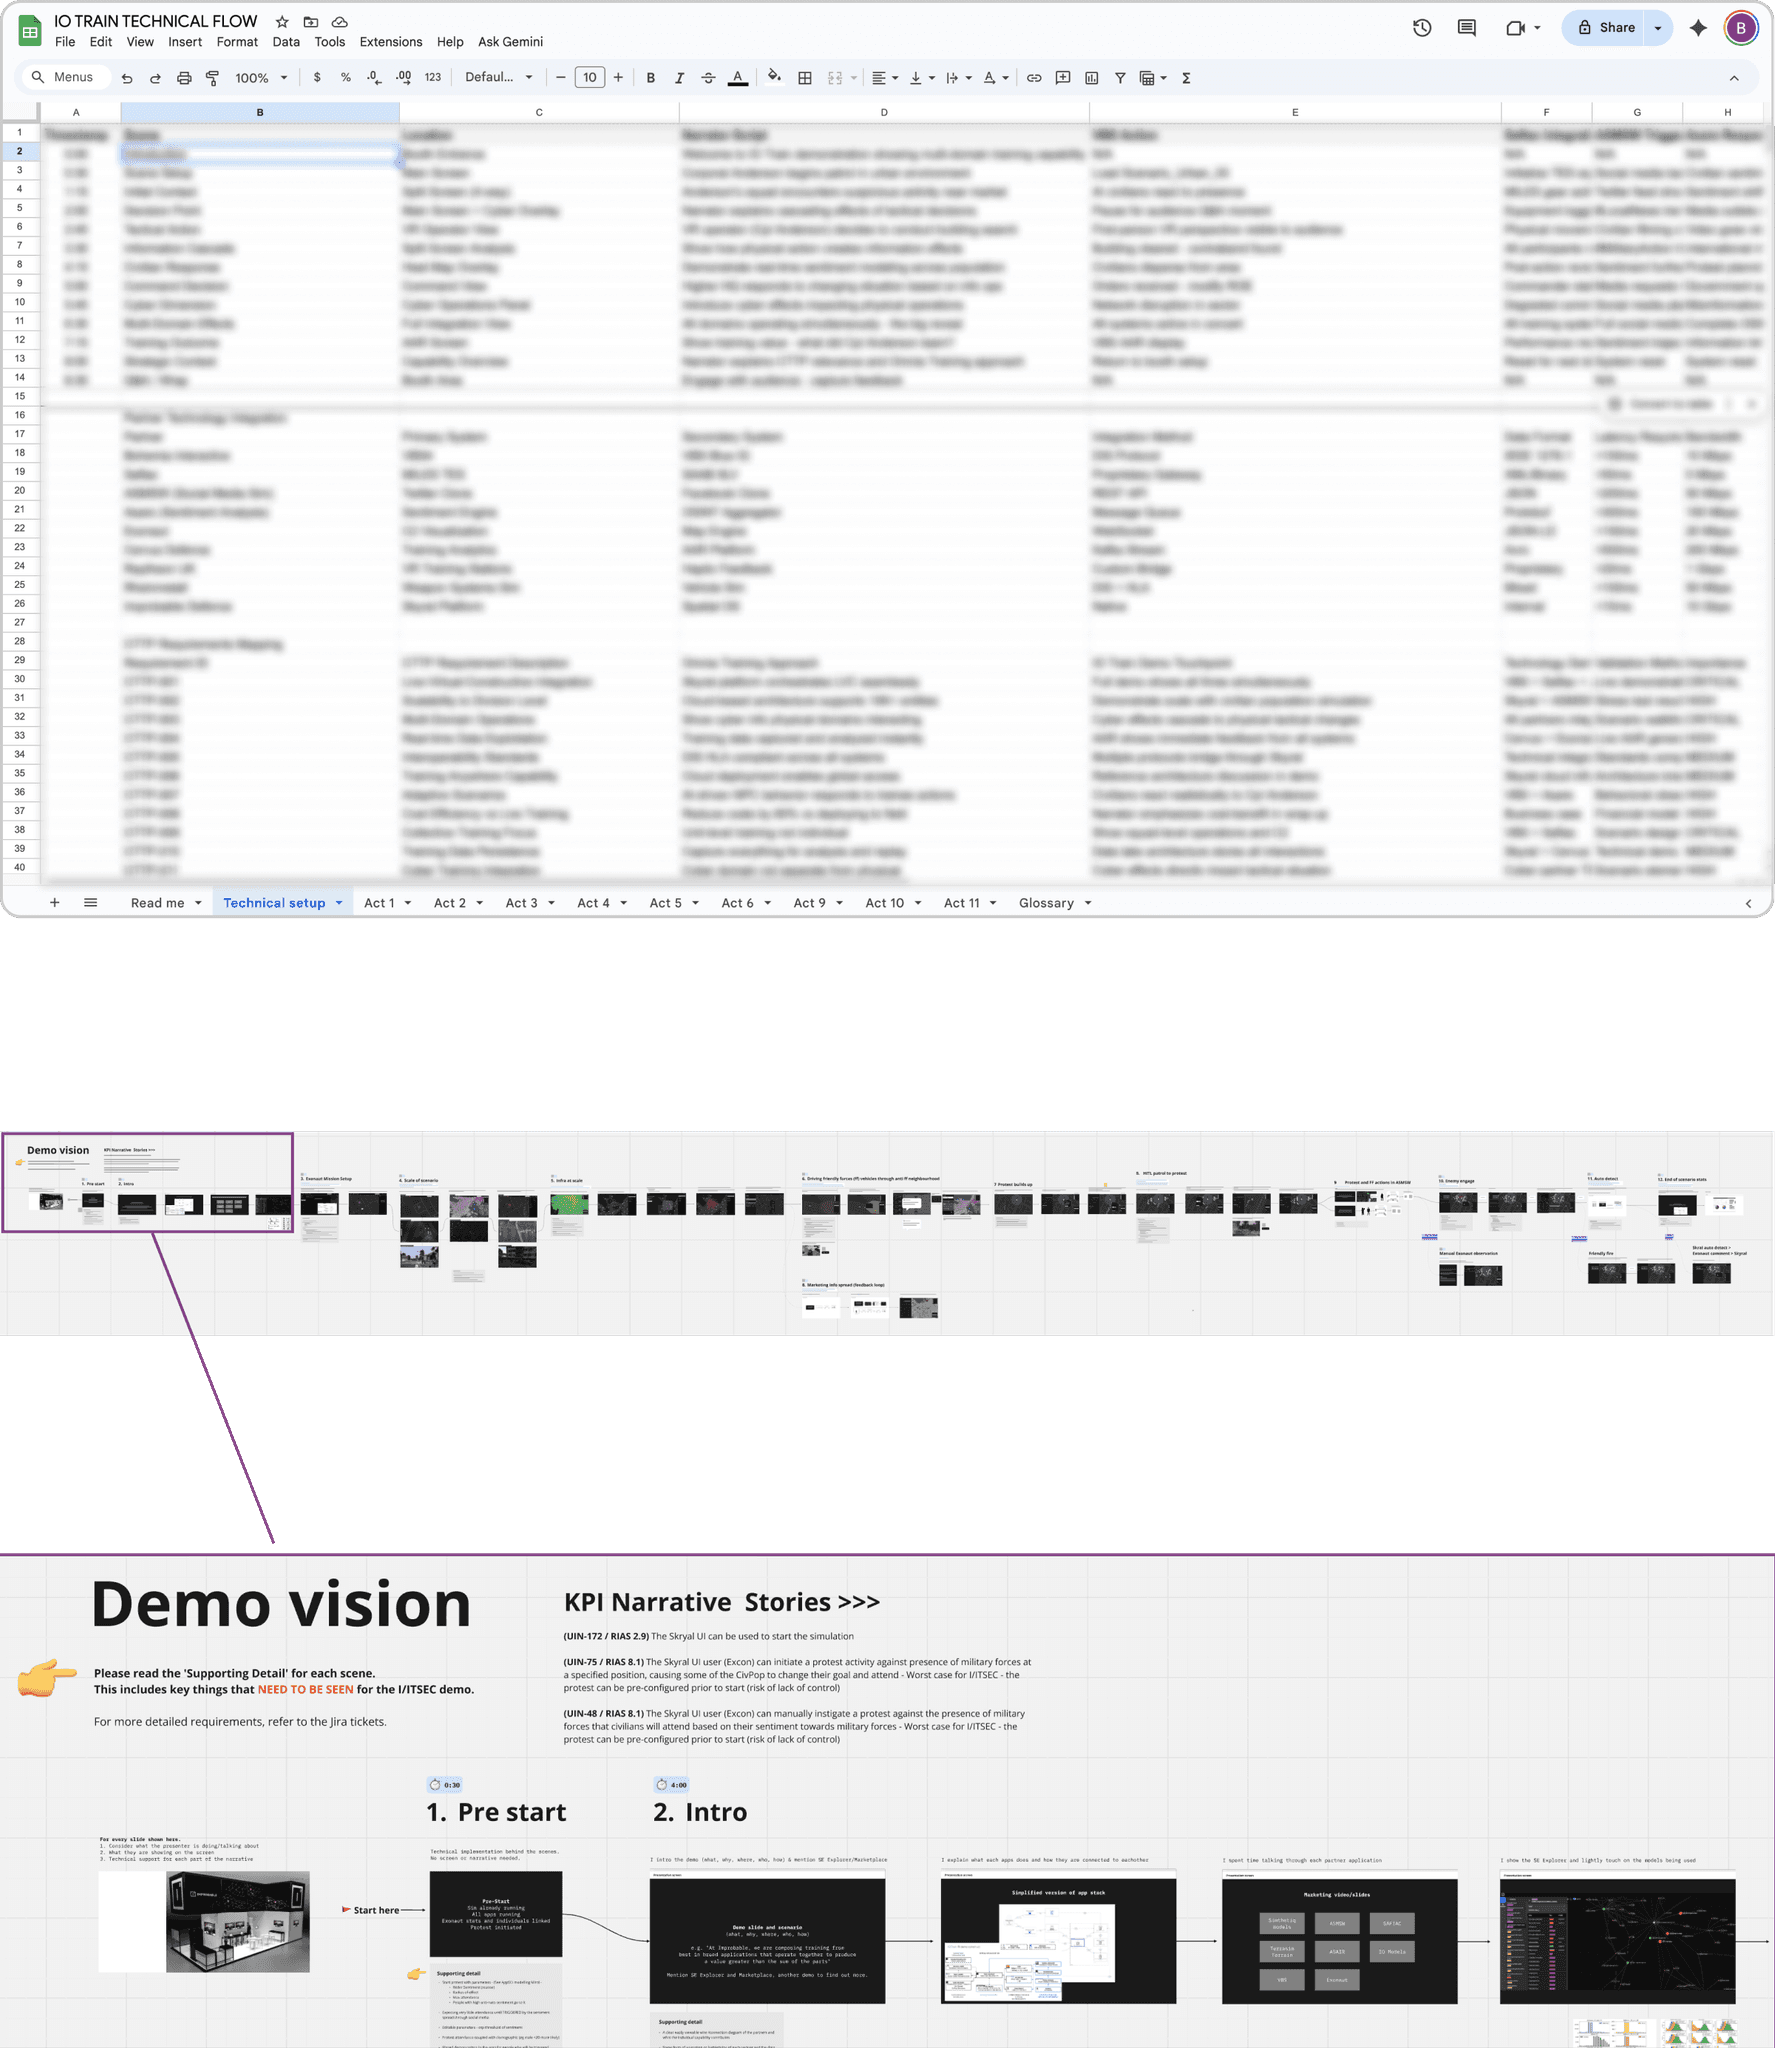
Top: The complex Google sheet. Bottom: Storyboard in Miro
The story that brought it together
Built as both a blueprint for engineers and a contingency plan in case the live demo wasn’t ready for the conference. We created an eight act narrative that demonstrated technical capabilities through a realistic military scenario:
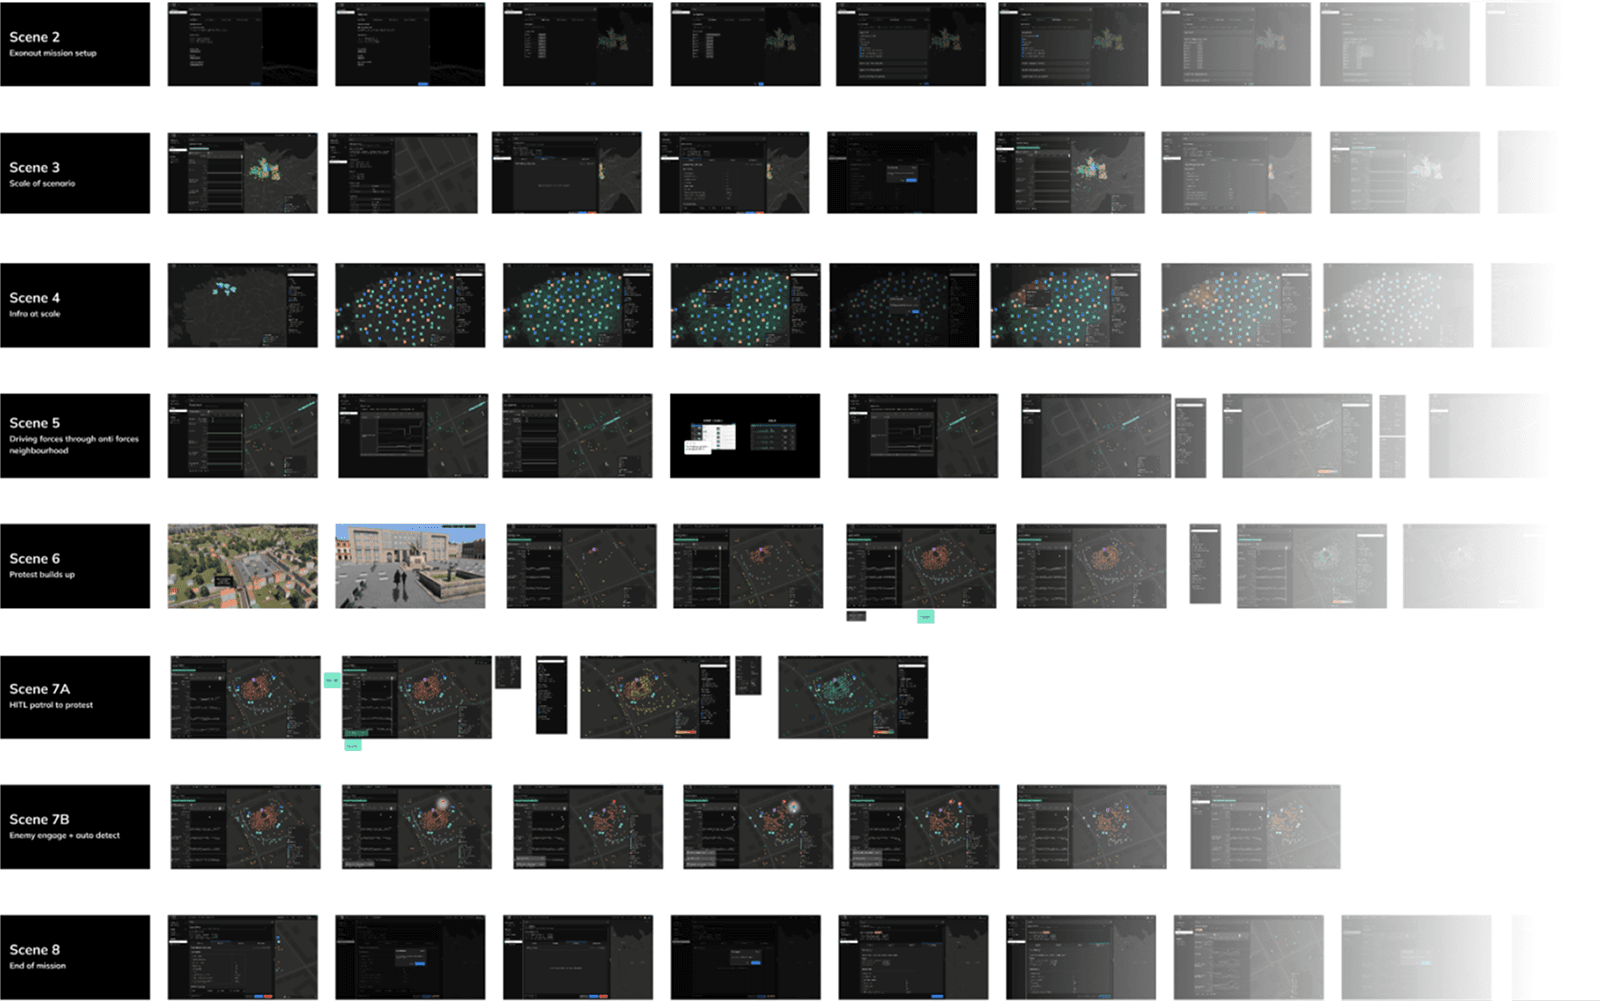
High fidelity storyboard in Figma

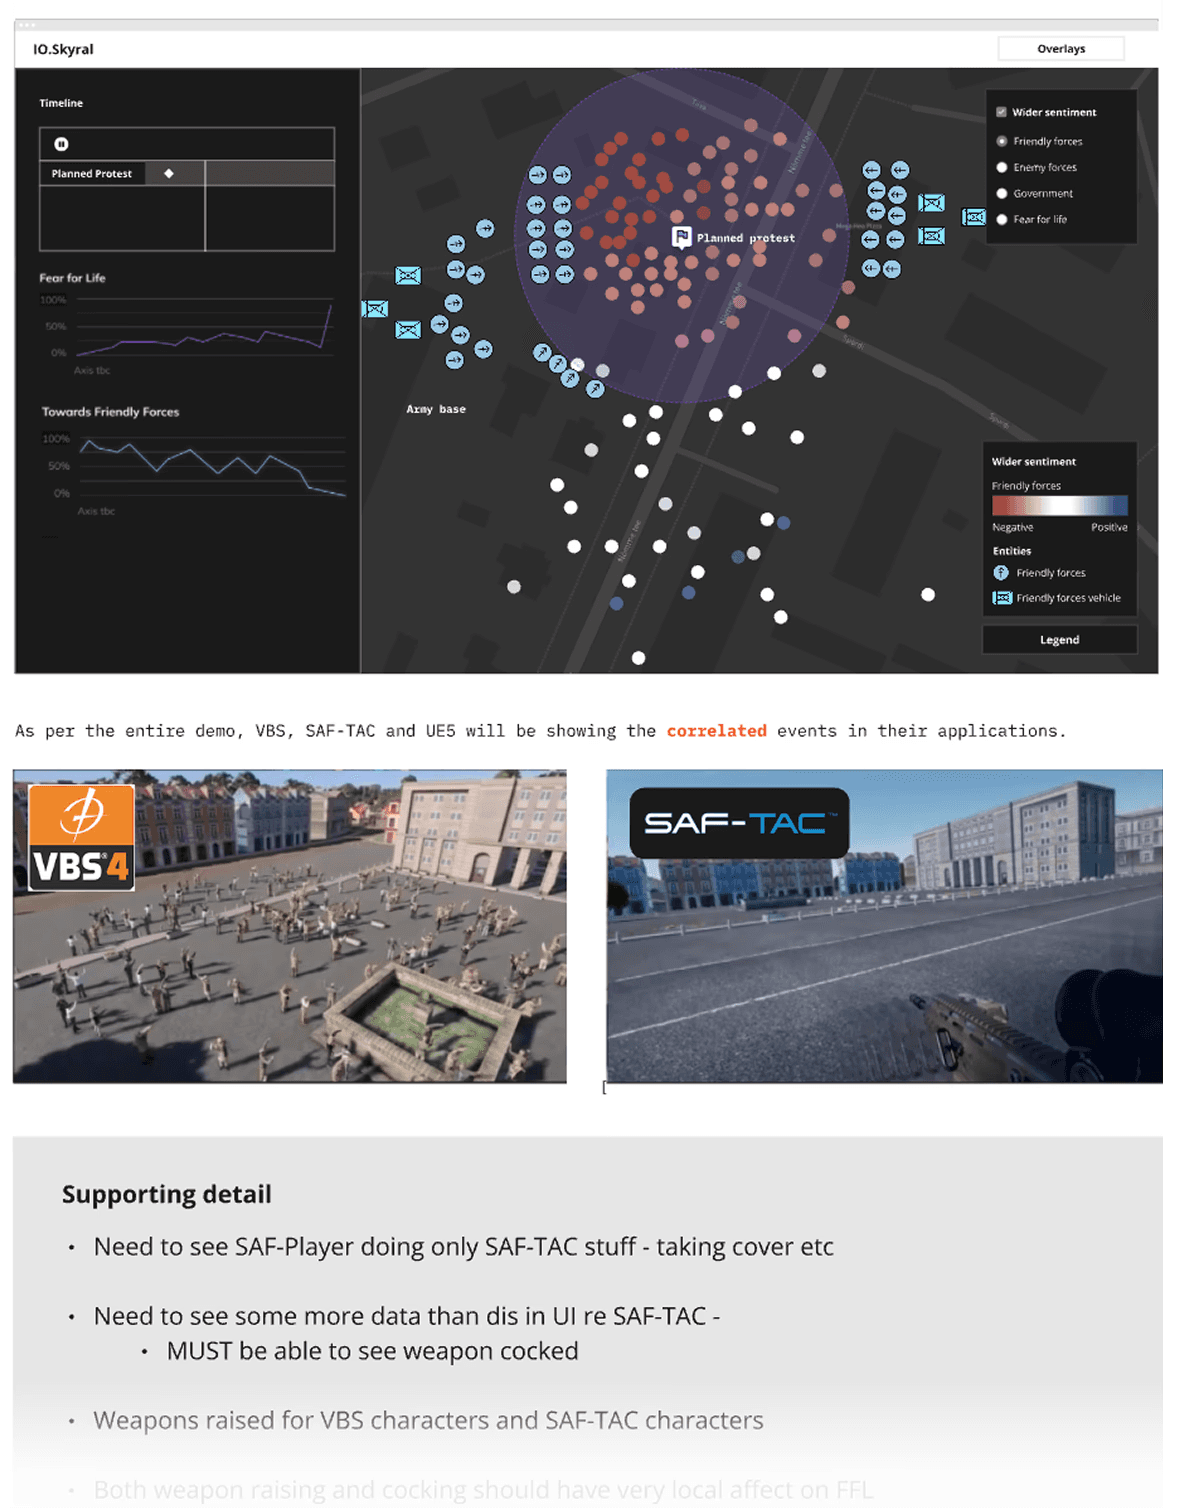

Storyboard showing low fidelity Skyral screen, VBS and SAF-TAC
Design
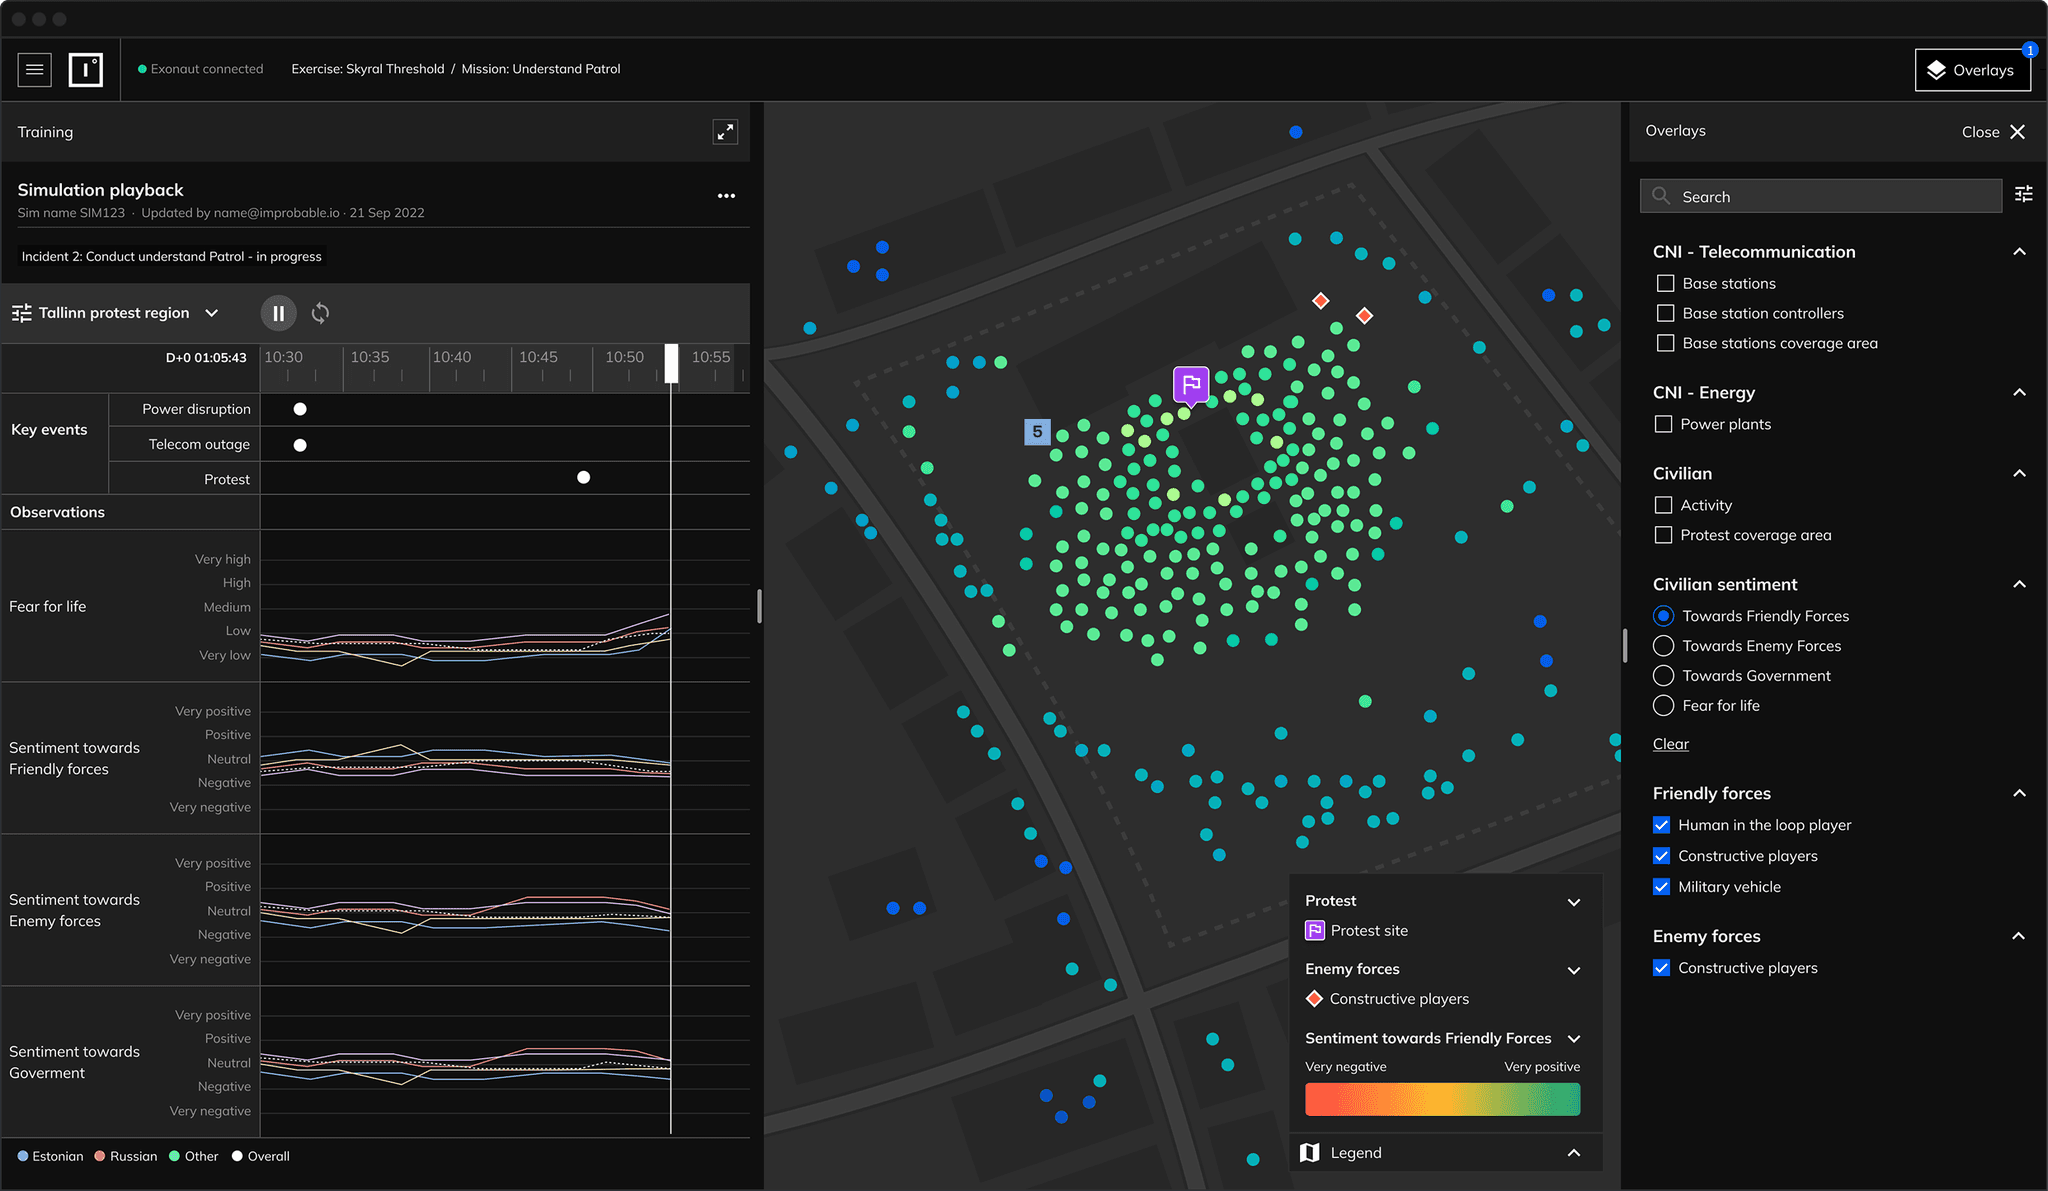
I designed an interface that brought simplicity to complex multi-domain data, connecting sentiment feeds, geospatial overlays, and analysis tools within a single visual framework.
Key interface features:
Top ribbon: Navigation, system status
Live simulation playback: Switch between geographic regions, timeline visualising key events and sentiment trends over time, key sentiment by nationality
Map view: Dots represent human, live, and constructive players; legend explaining sentiment, actors and overlays; layers for CNI, forces, civilians and sentiment by group
The interface had to handle 250,000+ entities while remaining readable and supporting the narrative, showing overwhelming complexity when needed, but simplifying to clarity for decision-critical moments.
Rehearsing the demo
The team rehearsed daily for weeks, fine-tuning system links, visuals, and timing to deliver a polished, reliable live demonstration.
We structured rehearsals like theatre:
Full run-through every morning with no stopping (built resilience for live conditions)
Debrief to prioritise issues (demo-killers first, then narrative problems, then polish)
Validation runs of corrected sections
The "no stopping" rule was critical, it forced us to develop workarounds and built muscle memory for handling problems gracefully during live demos
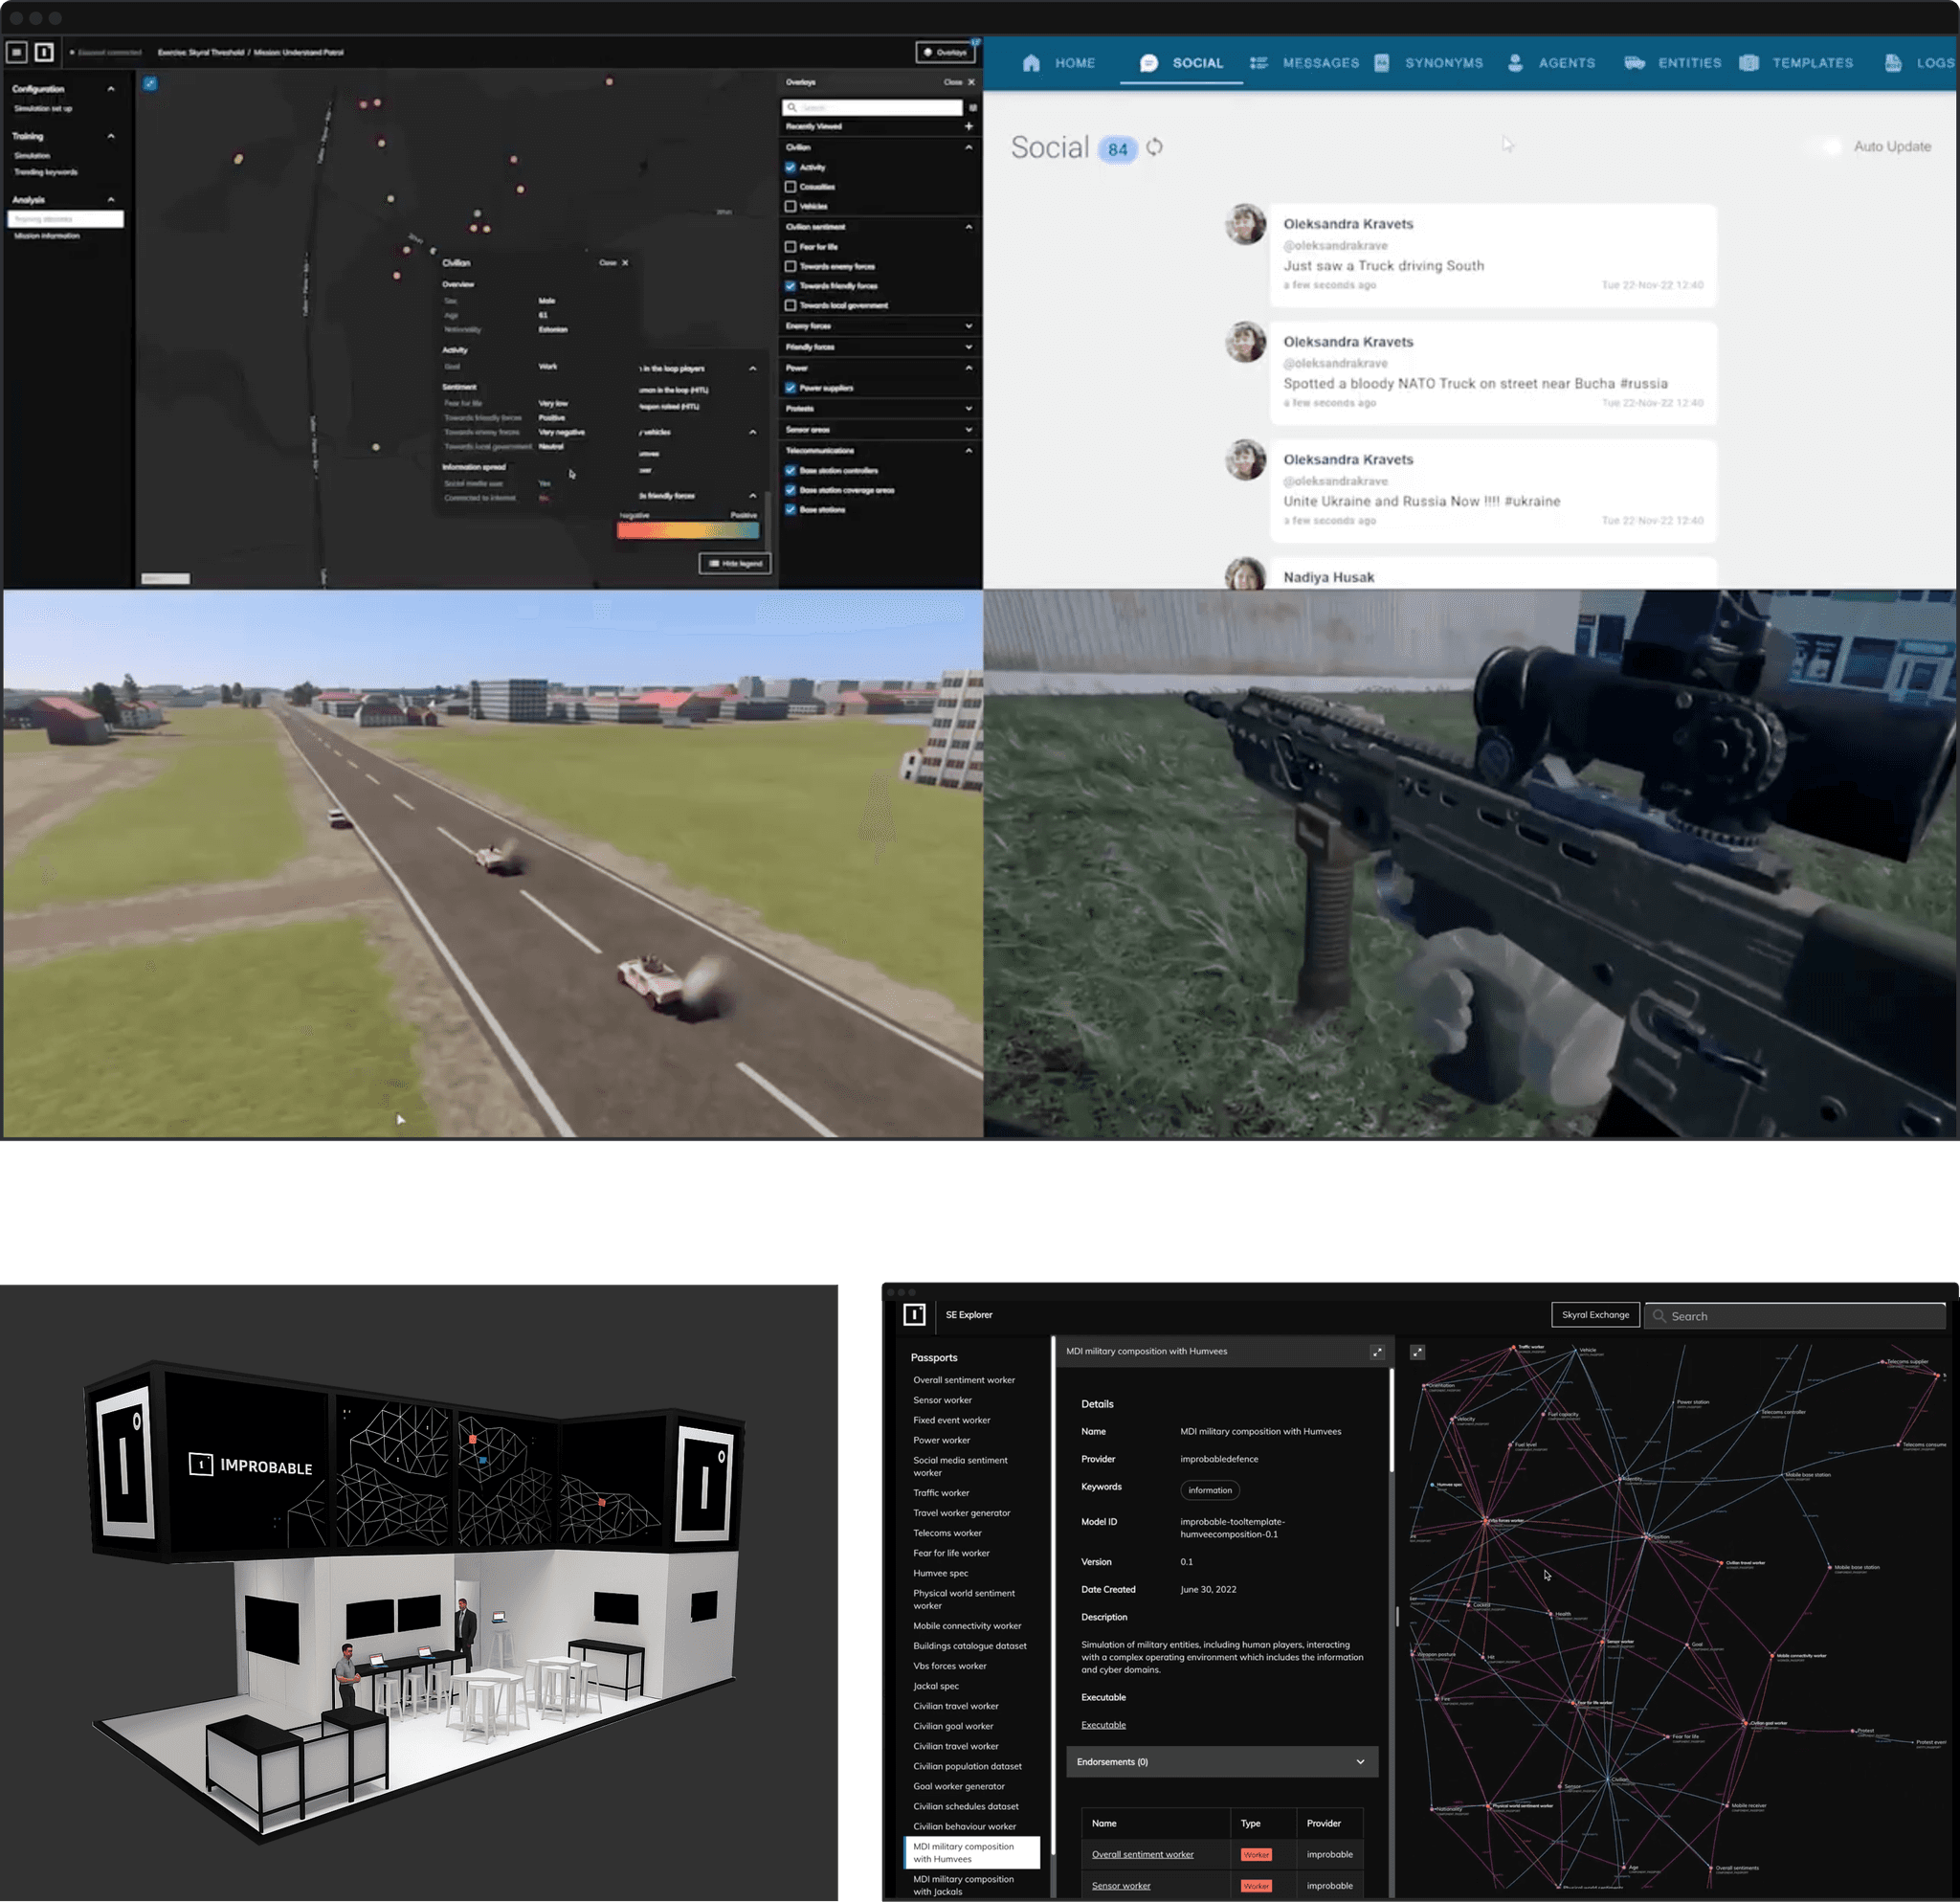
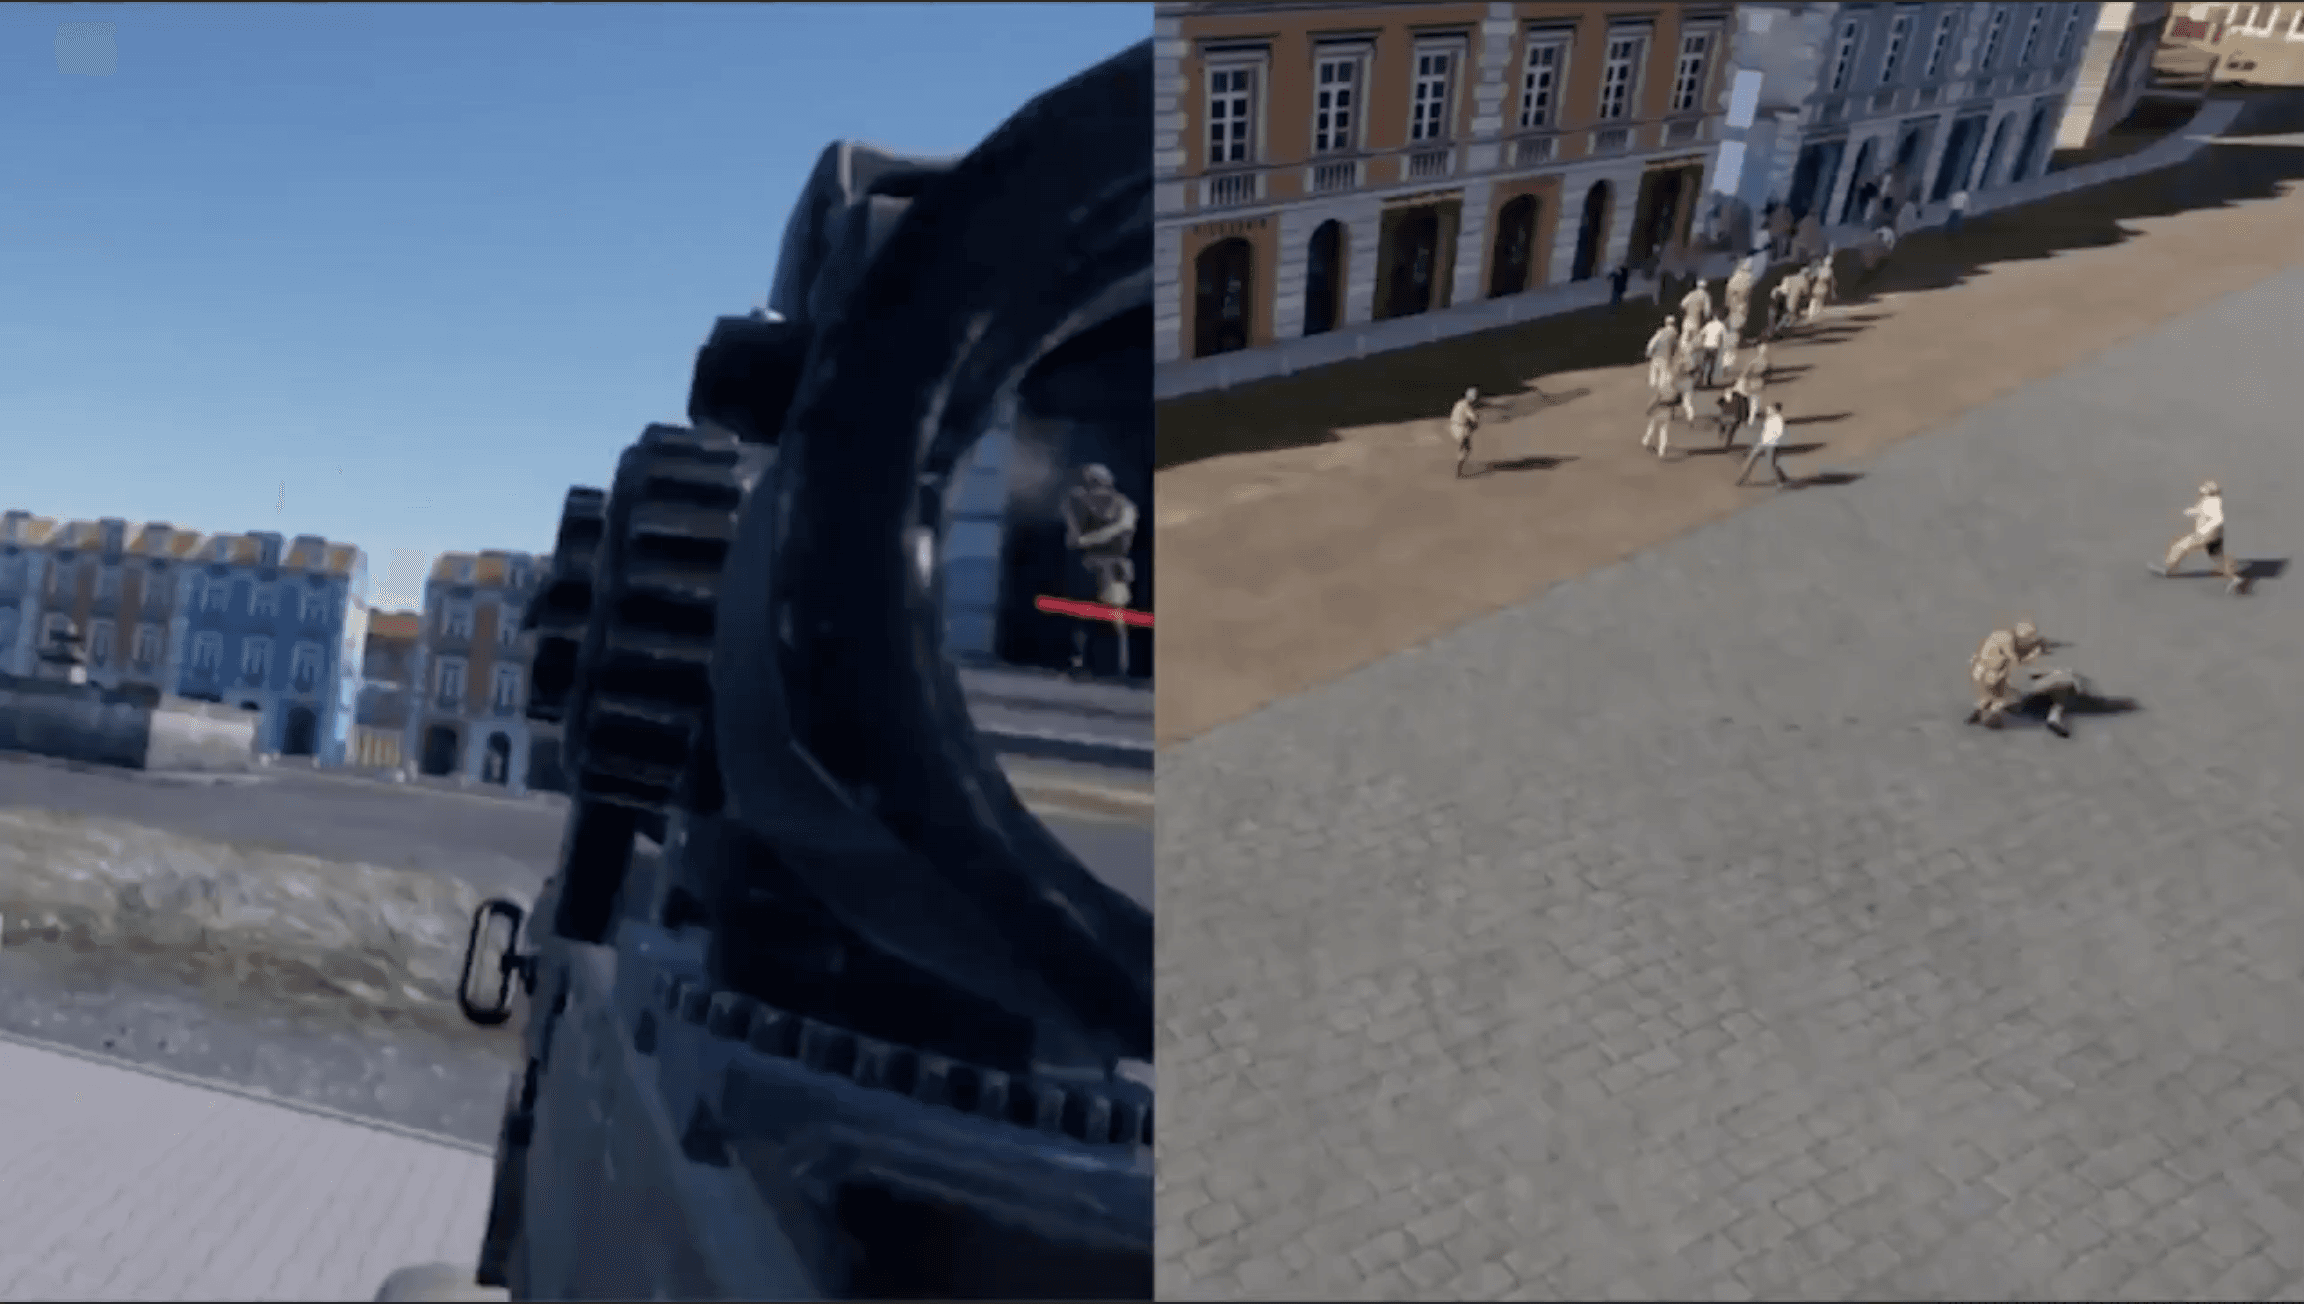
Top: Demo split view showing Skyral, Social media feed, VBS and SAF-TAC. Bottom left: CGI of exhibition design. Bottom right: Syntethic Explorer, market place to data models.
Live demos set us apart from competitors' recorded videos
Reflections and learnings
12 weeks to deliver the imposible. How investing in clarity and shared vision accelerated everything else
Live event research is different
Conference research requires different skills: rapid screening, finding quiet spaces, real-time synthesis amid chaos.
Resourcefulness under pressure
Tight timelines and shifting priorities required adaptability over process.Staying flexible kept momentum when conditions changed daily.
Domain knowledge is essential
Understanding CTTP requirements, multi-domain operations, and LVC training wasn't optional, it enabled better design decisions and credible stakeholder conversations.
Click the video below to see the demo in action